# DEX Metrics
MarketMaker 2.0 (MM2) collects data metrics that allow interested users to view the history of events of a MM2 session. For example, metrics recorded by MM2 include incoming and outgoing traffic.
The metrics can be:
- Recorded to a log file at a specified frequency
- Requested using AtomicDEX API in JSON format
- Visualized using Prometheus and Grafana
# Setting Up the Log Recording
By default, the collected metrics are recorded to a log file every five minutes.
A custom time interval can be set during the initiation of the MarketMaker 2.0 software.
For example, to set the interval to two minutes, initiate MM2 with the additional argument \"metrics\":120, as follows.
TIP
Note that in the examples below, the you will need to change the text to reflect your own password and passphrase.
Example:
stdbuf -oL ./mm2 "{\"gui\":\"MM2GUI\",\"netid\":9999, \"userhome\":\"/${HOME#"/"}\", \"passphrase\":\"YOUR_PASSPHRASE_HERE\", \"rpc_password\":\"YOUR_PASSWORD_HERE\", \"metrics\":120}" &
To prohibit the recording of metrics to the log file, set the metrics argument to 0.
Example:
stdbuf -oL ./mm2 "{\"gui\":\"MM2GUI\",\"netid\":9999, \"userhome\":\"/${HOME#"/"}\", \"passphrase\":\"YOUR_PASSPHRASE_HERE\", \"rpc_password\":\"YOUR_PASSWORD_HERE\", \"metrics\":0}" &
# API Calling
Execute the following command to request a metrics snapshot.
curl --url "http://127.0.0.1:7783" --data "{\"method\":\"metrics\"}"
The response should be similar to the following.
{
  "metrics": [
    {
      "key": "rpc_client.traffic.out",
      "labels": { "coin": "RICK", "client": "electrum" },
      "type": "counter",
      "value": 92
    },
    {
      "key": "rpc_client.traffic.in",
      "labels": { "coin": "RICK", "client": "electrum" },
      "type": "counter",
      "value": 125
    }
  ]
}
# Prometheus Integration
MarketMaker 2.0 supports integration with Prometheus. This software allows users to setup automated scraping of metrics at regular intervals and enables sophisticated queries on the stored timeseries (opens new window) data. It also allows users to configure an elegant dashboard using built-in graphs, (opens new window) or to export data for graphical processing using Grafana (opens new window).
Prometheus scrapes metrics using an HTTP pull model.
To provide Prometheus with the ability to scrape the metrics at localhost:9001, initiate MM2 with the following additional argument:
\"prometheusport\":9001
You may optionally specify the username and password for Prometheus to enforce basic authorization security. For this effect, add one more argument as follows:
\"prometheus_credentials\":\"PROM_USERNAME:PROM_PASSWORD\"
Note that this additional argument is NOT necessary.
Replace PROM_USERNAME and PROM_PASSWORD with your actual Prometheus username and password.
Note that the username and password should be separated by :.
Example:
stdbuf -oL ./mm2 "{\"gui\":\"MM2GUI\",\"netid\":9999, \"userhome\":\"/${HOME#"/"}\", \"passphrase\":\"YOUR_PASSPHRASE_HERE\", \"rpc_password\":\"YOUR_PASSWORD_HERE\", \"prometheusport\":9001, \"prometheus_credentials\":\"PROM_USERNAME:PROM_PASSWORD\"}" &
# Configuring Prometheus to monitor MarketMaker 2.0
The following basic Prometheus configuration file, named prometheus.yml, can simplify the process of connecting Prometheus to MarketMaker2.0.
global:
  scrape_interval: 10s
scrape_configs:
  - job_name: 'MarketMaker2'
    basic_auth:
      username: 'PROM_USERNAME'
      password: "PROM_PASSWORD"
    static_configs:
      - targets: ['0.0.0.0:9001']
Replace PROM_USERNAME and PROM_PASSWORD with your actual Prometheus username and password.
To learn more about creating a Prometheus configuration file, read this documentation. (opens new window)
# Starting Prometheus and Grafana
A simple way to initiate Prometheus and Grafana is to have the standard Prometheus and Grafana docker containers run together using docker-compose.
Name the following compose file as docker-compose.yml.
version: "3.1"
volumes:
  prometheus:
  grafana:
services:
  grafana:
    image: grafana/grafana:latest
    depends_on:
      - prometheus
    ports:
      - '3000:3000'
    network_mode: "host"
    volumes:
      - grafana:/var/lib/grafana
    restart: always
  prometheus:
    image: prom/prometheus:latest
    ports:
      - '9090:9090'
    network_mode: "host"
    volumes:
      - ./prometheus.yml:/etc/prometheus/prometheus.yml
      - prometheus:/prometheus
    restart: always
Use the following command to start both containers.
docker-compose up
# Using the graphing interface
# Prometheus
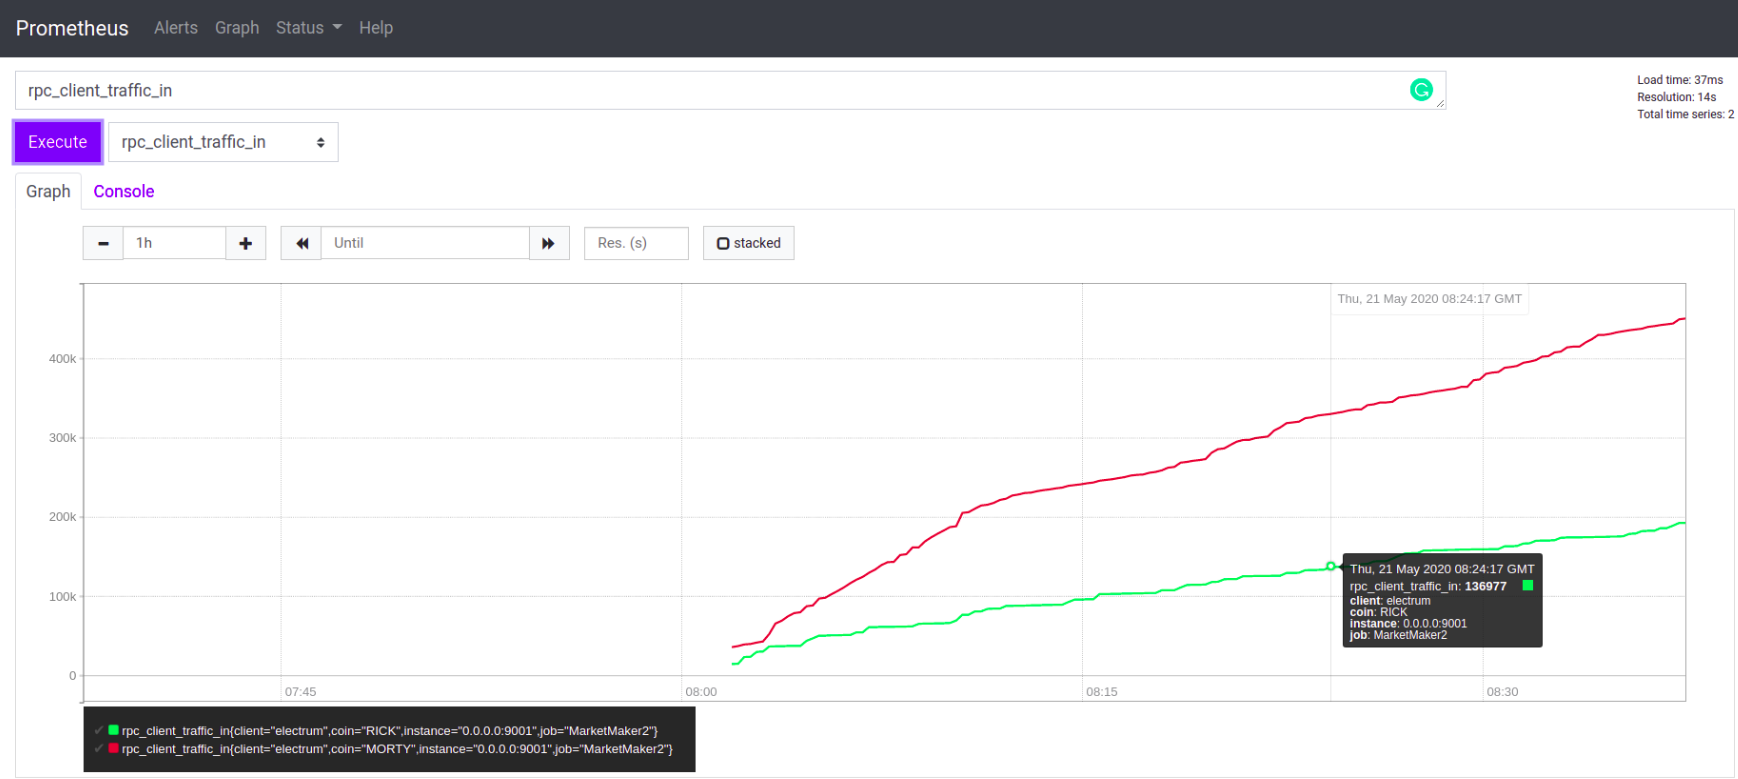
Once the docker containers are up and running, navigate to http://localhost:9090/graph (opens new window) and use the Graph tab to use Prometheus's built-in graph expressions.
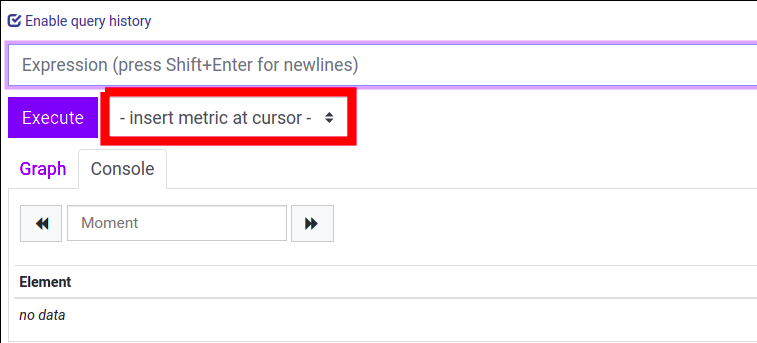
To visualize one of the available metrics, click on the dropdown menu highlighted in the following picture, select a metric and then click execute.
The graphical representation of the metric can be viewed in the Graph tab.
More graphs can be added to the same page using the "Add Graph" button available.
# Grafana
Grafana can access data scraped by Prometheus and it can analyze, transform and display it in a variety of ways. For more information see the Prometheus guide. (opens new window)
To use Grafana, navigate to http://localhost:3000 (opens new window) and log in using the default credentials: admin / admin. When offered to set a new password, do so and remember it.
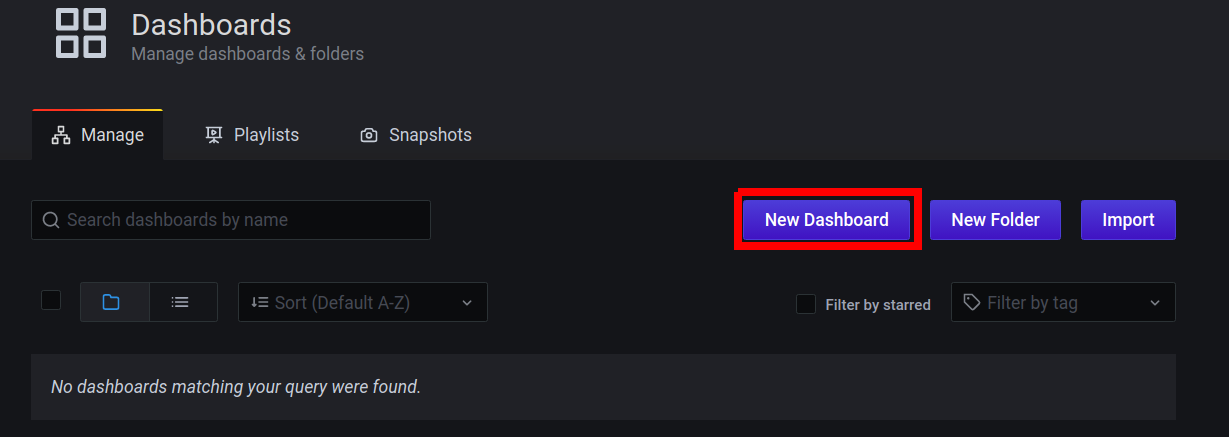
Next, navigate to http://localhost:3000/dashboards (opens new window) and click on the New Dashboard button
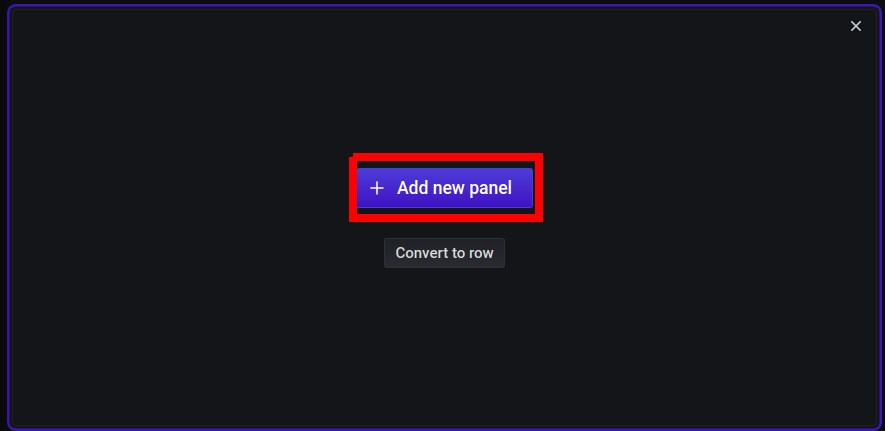
Next, click the Add Panel button
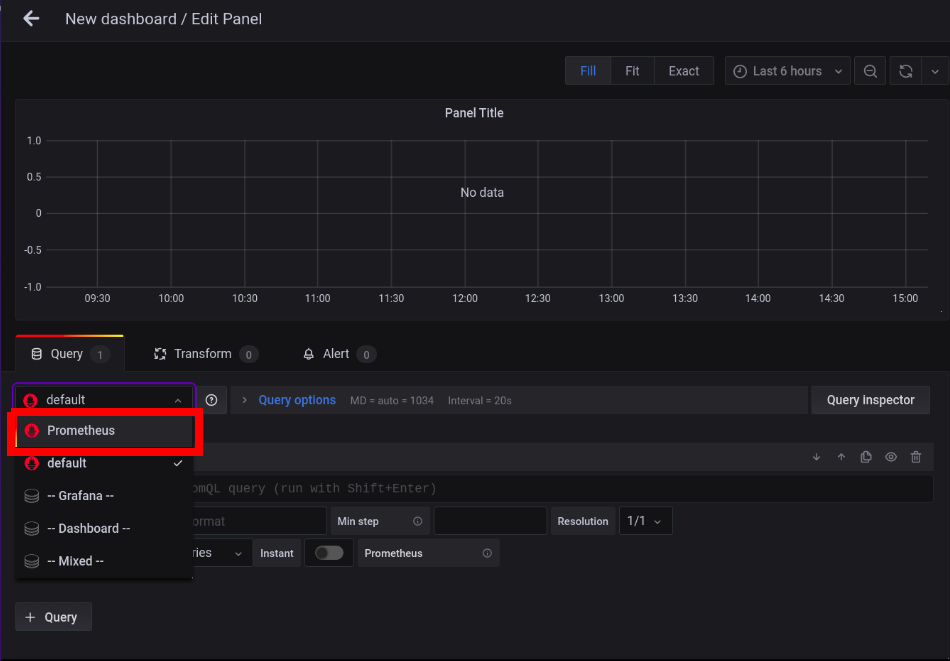
In the next screen, select Prometheus as the provider from the drop down menu in the Query tab.
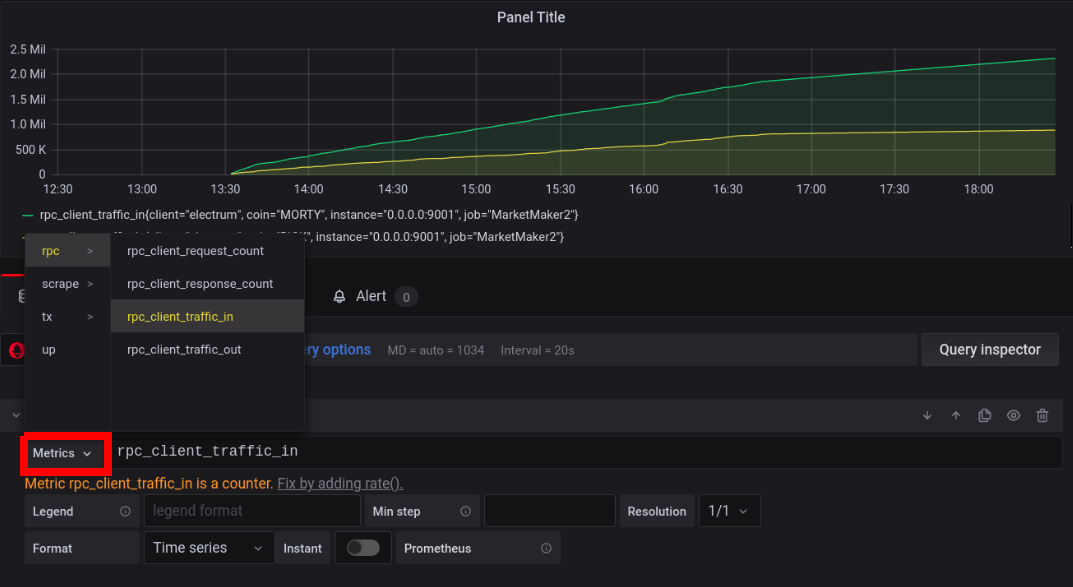
Click the Metrics menu and select one of the available options. These should be the same ones available directly in the Graphs tab of Prometheus: http://localhost:9090/graph (opens new window).
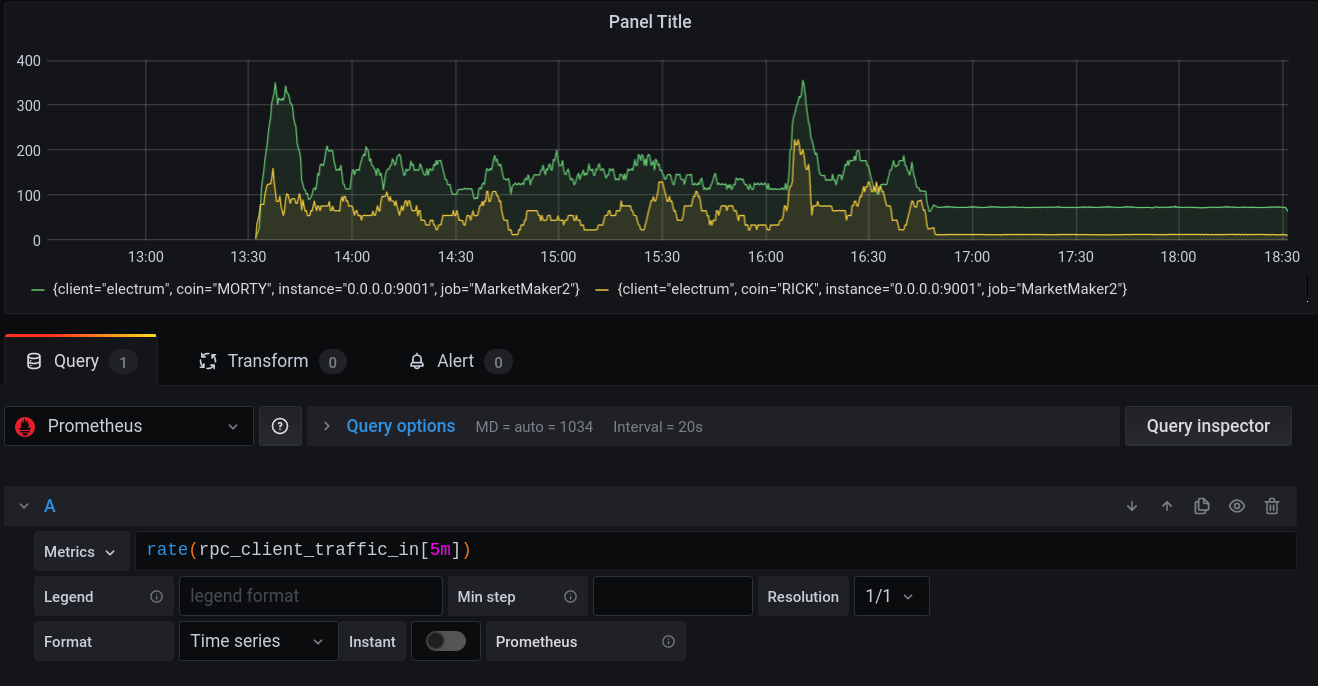
Optionally, follow the hint to add rate in the previous screen by clicking Fix by adding rate(). This results in the following screen.
Click the Save button and set a name for the dashboard.
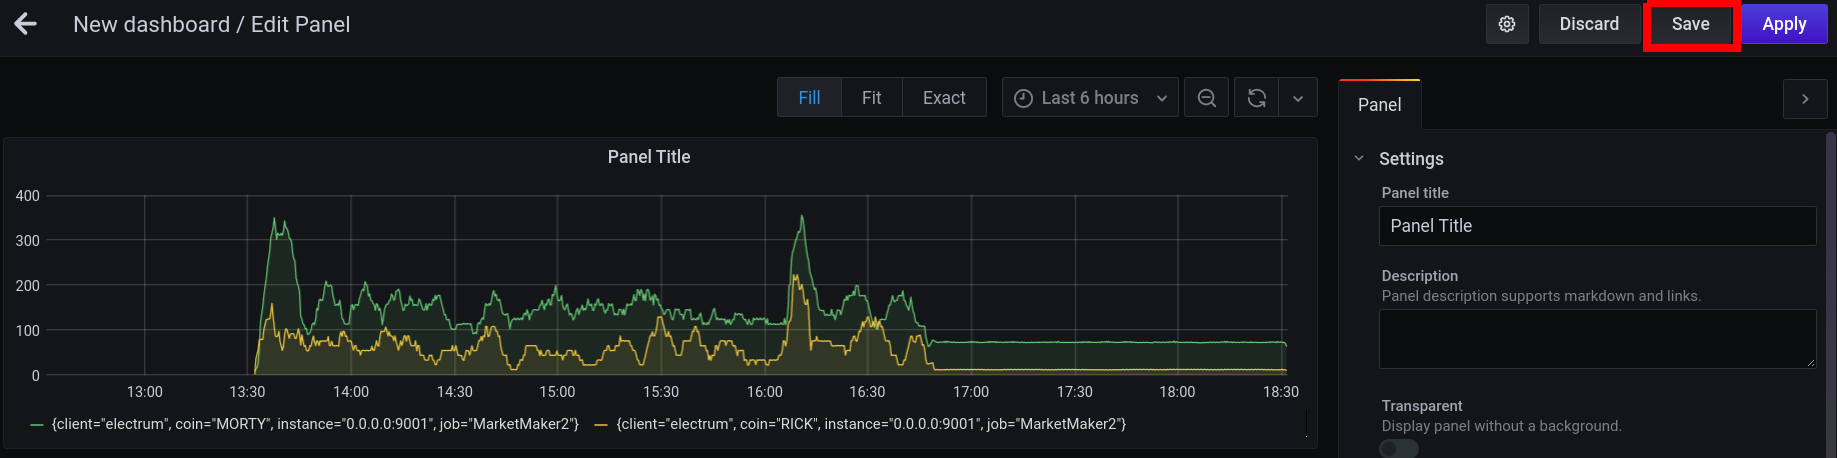
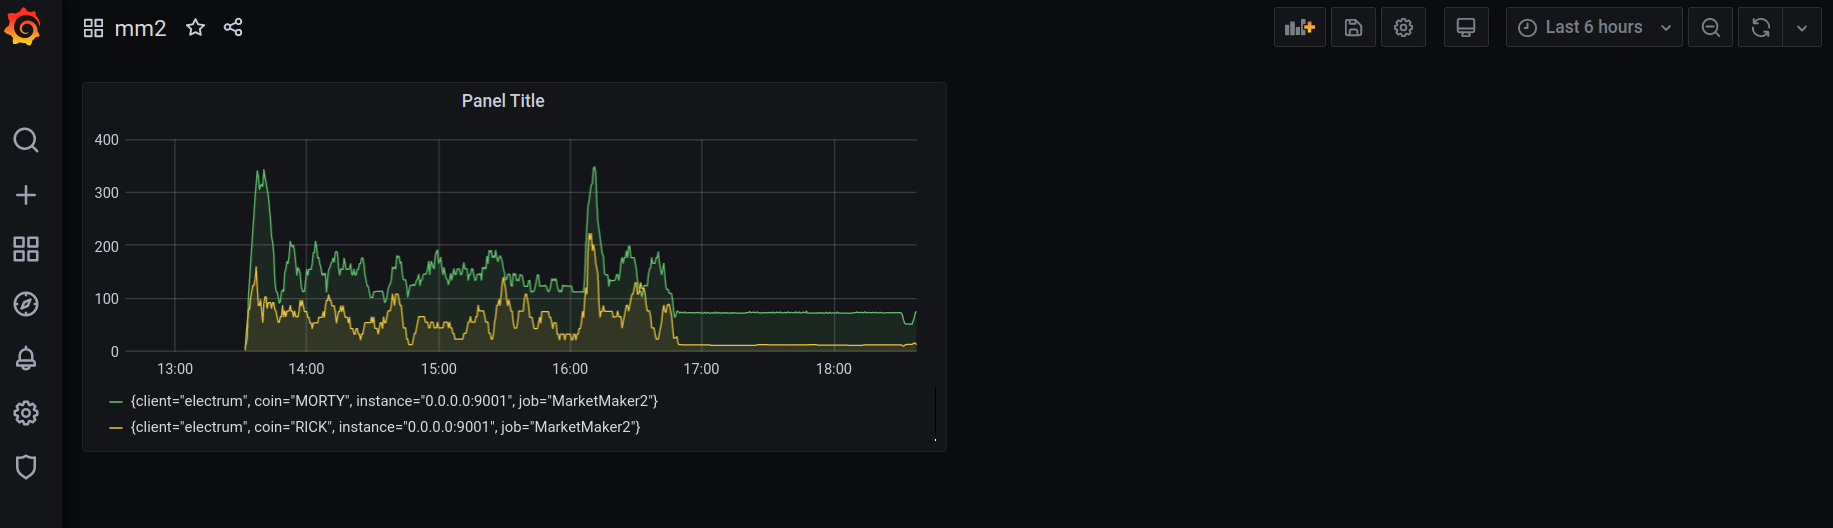
Now you have a Grafana dashboard with a panel that shows a graph of the rpc_client_traffic_in.